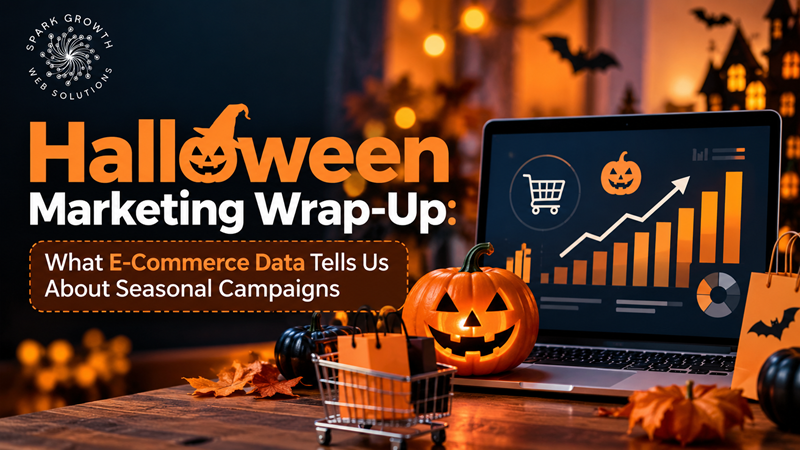
Halloween is easy to underestimate as a marketing moment if your business isn’t selling costumes or candy directly. The spending data says otherwise — this is a genuinely large, well-documented consumer event, and the patterns behind it hold useful lessons for seasonal marketing generally, regardless of your specific industry. SparkGrowth Web Solutions looks at what actually happened this Halloween season as a useful mirror for how any seasonal campaign should be planned.
What the Numbers Actually Showed This Year
According to the National Retail Federation’s 2026 consumer survey, US Halloween spending was projected to reach $13.5 billion — maintaining the strong level set by last year’s record $13.1 billion, despite consumers approaching the season with more affordability awareness given ongoing inflation and tariff pressure. Candy remained the single most popular purchase category, with 96% of consumers planning to buy sweets, accounting for roughly $4.1 billion in spending on its own.
Perhaps the most instructive figure for marketers generally: nearly 49% of shoppers began their Halloween shopping in September — a trend that has grown steadily over the past decade, up from just 34% in 2016. Halloween, in other words, isn’t really a one-day event from a shopping behavior standpoint. It’s a multi-week window that starts well before the actual date.
What This Reveals About Seasonal Campaigns Generally
Lesson 1: Early Shoppers Are a Real Segment, Not an Edge Case
With half of shoppers starting a full month or more before the holiday itself, a campaign that only ramps up in the final week is missing roughly half its potential audience. This pattern isn’t unique to Halloween — most seasonal shopping windows have shifted earlier over the past decade, and campaigns planned around the “traditional” peak date alone consistently underperform ones that account for early shoppers.
Lesson 2: Affordability Messaging Matters, Even in a Resilient Category
Despite strong overall spending, this year’s data showed consumers explicitly balancing enthusiasm with cost awareness. Retailers who led with clear value framing — a meaningful share of stock under specific, accessible price points — aligned better with actual consumer sentiment than those assuming enthusiasm alone would override price sensitivity.
Lesson 3: One Dominant Category Doesn’t Mean Ignore the Rest
Candy led spending by a wide margin, but decorations, costumes, and even pet costumes each represented substantial, distinct spending categories with their own audiences and motivations. A campaign that only speaks to the single largest category misses meaningfully sized adjacent audiences.
Lesson 4: A Calendar-Fixed Holiday Still Has Variable Behavior Year to Year
Halloween falls on the same date every year, but consumer sentiment, spending levels, and timing still shift based on broader economic conditions. Assuming this year’s campaign should mirror last year’s exactly, without checking current sentiment, risks missing a real shift.
Applying This Beyond Halloween
Whatever seasonal moments matter to your specific business — a slow season, a local event, an industry-specific peak — the same underlying questions apply: When does real shopping or decision-making behavior actually start, relative to the event itself? What’s the current economic sentiment your audience is bringing into this specific season? Which secondary audiences beyond your obvious core customer might you be missing?
This kind of seasonal planning is part of the broader content and marketing strategy work we do with clients — treating each seasonal moment as its own specific planning exercise rather than a copy-paste of the previous year.
Planning Your Next Seasonal Push
If your business has a seasonal peak coming up and you want to plan around actual current behavior rather than assumptions, SparkGrowth Web Solutions can help build a campaign timeline that accounts for when your specific audience actually starts engaging.
Frequently Asked Questions
When should a seasonal campaign actually start, based on this data?
For events with a similarly early-shopping pattern, starting visible campaign activity at least a month before the event itself captures meaningfully more of the audience than starting the final week.
Does this data apply outside the US?
The specific figures are US-focused, though the underlying pattern — shopping windows starting earlier than the event itself — tends to hold across many markets and seasonal events, even if exact timing and dollar figures differ.
How do I find similar data for my own industry’s seasonal peak?
Industry associations and retail federations relevant to your sector often publish similar seasonal consumer surveys — worth checking before assuming your timing based on instinct alone.